
The 10 Provinces, the Yukon and the Northwest Territories reported to CIHI that in 1998 there were 110,331 therapeutic abortions performed on Canadian women. The number of induced abortions recorded for every 100 live births rose to 32.2.
Table 1: Annual Therapeutic Abortions and Abortion Rates for Canadian Women from 1970 – 1998.
| Number of Abortions | Rates per 100 Live Births | Rate per 1000 Females Ages 15-44 Years | ||||||||||
| Year | Hospital Events | Clinic Events | From USA | Total | Hospital Events | Clinic Events | From USA | Total | Hospital Events | Clinic Events | From USA | Total |
| 1970 | 11,152 | — | 11,152 | 3.0 | — | 3.0 | 2.5 | — | 2.5 | |||
| 1971 | 30,923 | — | 6,309 | 37,232 | 8.5 | — | 1.7 | 10.2 | 6.6 | — | 1.7 | 8.3 |
| 1972 | 38,853 | — | 6,573 | 45,426 | 11.2 | — | 1.9 | 13.1 | 8.2 | — | 1.5 | 9.7 |
| 1973 | 43,201 | — | 5,501 | 48,702 | 12.6 | — | 1.6 | 14.2 | 8.9 | — | 1.2 | 10.1 |
| 1974 | 48,136 | — | 4,299 | 52,435 | 13.7 | — | 1.2 | 14.9 | 9.6 | — | 0.8 | 10.4 |
| 1975 | 49,311 | — | 4,394 | 53,705 | 13.7 | — | 1.2 | 14.9 | 9.6 | — | 0.9 | 10.5 |
| 1976 | 54,478 | — | 4,234 | 58,712 | 15.1 | — | 1.2 | 16.3 | 10.3 | — | 0.8 | 11.1 |
| 1977 | 57,564 | — | 2,300 | 59,864 | 15.9 | — | 0.6 | 16.5 | 10.6 | — | 0.5 | 11.1 |
| 1978 | 62,290 | 2,618 | 1,802 | 68,710 | 17.4 | 0.7 | 0.5 | 18.6 | 11.3 | 0.5 | 0.2 | 12.0 |
| 1979 | 65,043 | 3,629 | 1,073 | 69,745 | 17.8 | 1.0 | 0.3 | 19.1 | 11.6 | 0.6 | 0.2 | 12.4 |
| 1980 | 65,751 | 4,704 | 1,644 | 72,099 | 17.7 | 1.3 | 0.4 | 19.4 | 11.5 | 0.8 | 0.3 | 12.6 |
| 1981 | 65,053 | 4,207 | 2,651 | 71,911 | 17.5 | 1.1 | 0.7 | 19.3 | 11.1 | 0.7 | 0.5 | 12.3 |
| 1982 | 66,254 | 4,506 | 4,311 | 75,071 | 17.8 | 1.2 | 1.2 | 20.2 | 11.1 | 0.7 | 0.7 | 12.5 |
| 1983 | 61,750 | 3,635 | 3,983 | 69,368 | 16.5 | 1.0 | 1.1 | 18.6 | 10.2 | 0.6 | 0.6 | 11.4 |
| 1984 | 62,247 | 3,571 | 3,631 | 69,449 | 16.5 | 0.9 | 1.0 | 18.4 | 10.2 | 0.6 | 0.6 | 11.4 |
| 1985 | 62,712 | 3,706 | 2,798 | 69,216 | 16.7 | 1.0 | 0.7 | 18.4 | 10.2 | 0.6 | 0.5 | 11.3 |
| 1986 | 63,462 | 3,498 | 2,612 | 69,572 | 17.0 | 0.9 | 0.7 | 18.6 | 10.2 | 0.6 | 0.4 | 11.2 |
| 1987 | 63,585 | 3,681 | 2,757 | 70,023 | 17.2 | 1.0 | 0.7 | 18.9 | 10.2 | 0.7 | 0.4 | 11.3 |
| 1988 | 66,137 | 4,617 | 1,939 | 72,693 | 17.6 | 1.2 | 0.5 | 19.3 | 10.6 | 0.7 | 0.3 | 11.6 |
| 1989 | 70,705 | 7,059 | 1,551 | 79,315 | 18.0 | 1.8 | 0.4 | 20.2 | 11.2 | 1.1 | 0.2 | 12.6 |
| 1990 | 71,092 | 20,236 | 1,573 | 92,901 | 17.5 | 5.0 | 0.4 | 22.9 | 11.2 | 3.2 | 0.2 | 14.6 |
| 1991 | 70,277 | 23,343 | 1,439 | 95,059 | 17.5 | 5.8 | 0.3 | 23.6 | 10.9 | 3.6 | 0.2 | 14.7 |
| 1992 | 70,408 | 31,151 | 526 | 102,085 | 17.7 | 7.8 | 0.1 | 25.6 | 10.4 | 4.6 | 0.1 | 15.1 |
| 1993 | 72,434 | 31,508 | 461 | 104,403 | 18.7 | 8.1 | 0.1 | 26.9 | 10.6 | 4.6 | 0.1 | 15.3 |
| 1994 | 71,630 | 34,287 | 338 | 106,255 | 18.6 | 8.9 | 0.1 | 27.6 | 10.5 | 5.0 | — | 15.5 |
| 1995 | 72,024 | 35,765 | 459 | 108,248 | 28.6 | |||||||
| 1996 | 74,555 | 36,803 | 351 | 111,659 | 30.5 | |||||||
| 1997 | 71,795 | 39,621 | 293 | 111,709 | 32.0 | |||||||
| 1998 | 68,273 | 41,761 | 297 | 110,331 | 32.2 | |||||||
Notes:
Figures for 1970 to 1995 are taken from Table 11, Pg.17). Figures for 1996, 1997 and 1998 from Statistics Canada website (www.statcan.ca), December 18, 2000, as sourced by CIHI.
All induced abortions are classified as “therapeutic” whether they are performed in a hospital or in a clinic. As of 1995, therapeutic abortion data are collected from reporting areas within and outside the country by the Canadian Institute for Health Information (CIHI). The data is then transferred to Statistics Canada for analysis and publication as catalogue number 82-219-XPB, Therapeutic Abortions 1995.
Since 1970, abortion figures have been compiled for hospital abortions. In 1978, Quebec began to report some figures for clinic abortions. In 1990, the clinic figures reported related to Quebec, Newfoundland, Nova Scotia, Ontario, Manitoba and British Columbia. In 1991, published clinic data included figures reported from Alberta. In 1994, clinic data included figures from New Brunswick.
The numbers under “From U.S.A.” are for legal abortions performed on Canadian women visiting the states along the Canada-United States border. Some states do supply numbers on request from Statistics Canada but in some states, legal abortions performed in clinics may not be reported to state authorities and reporting for non-residents is not mandatory. The figures printed represent a minimum estimate.
Summary.
It is increasingly difficult to formulate a profile of the women who undergo the abortion procedure because of incomplete demographic and medical case data.
In 1998 selected demographic and medical information was available for only 68.8% of hospital site abortions and for only 48.7% of clinic site abortions.
Overall, using combined hospitals and clinic figures, we learn that selected demographic and medical information is now available for only 61.08% of the110,331 induced abortions performed on Canadian women in 1998!
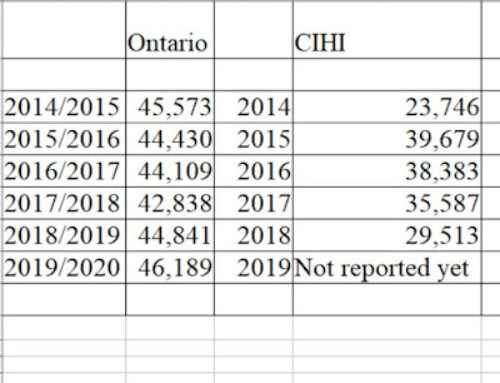
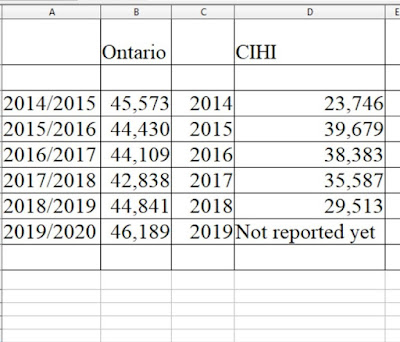
CLINICS: Although 37.85% % of the abortions were performed in clinics (41,761), only 2 provinces, Ontario and Alberta, provided some selected demographic and medical characteristics. Ontario accounts for 38.5% of all abortions reported in Canada (42,452 in 1998).
HOSPITALS: The trend continues for hospitals to no longer fully report items such as: age of the mother, marital status, previous deliveries, number of previous abortions, gestational age of the child at the time of abortion, nature of the abortion procedure, complications etc. Canadian hospitals reported 68,273 abortions in 1998 and database details are missing for 21,302 of these abortions (31.2%). Ten years ago, in 1988, the hospitals reported 66,137 abortions and case items were missing for 5,484 of these hospital cases (8%).
From the incomplete data obtained by the Canadian Institute for Health Information, Statistics Canada, Health Statistics Division reported that in 1998:
- 37.85% of induced abortions were performed in Canadian clinics (41,761).
- 62.05% of induced abortions were performed in Canadian hospitals (68,273).
- 297 Canadian women underwent legal abortions in the United States mostly along the Canadian-U.S. border.
- Hospital figures indicate that 310 girls under 15 years of age had abortions and a total of 464 girls under 15 were aborted in 1998.
- 83% of the women who had abortions in 1998 were not currently married at the time of their abortion.
- Approximately one half of the women undergoing an abortion in Canada had no other children.
- 20.6% of women (13,846) having clinic and hospital abortions were between 10-19 years old. This is the first time the age breakdown has started at 10 years of age.
- 51.3% of women (34,480) having clinic and hospital abortions were 20 to 29 years old and 24.8% of women (16,669) were 30 to 39 years of age.
- 37.4% of the women had undergone at least one previous abortion.
- 52% of the women who used clinics had no previous delivery.
- 48.2% of the women who used the hospitals had no previous delivery.
- Perhaps the most startling statistic is that women who have had at least one delivery account for a growing proportion of abortions: 38% in 1985 and 48.9% in 1998.
- The number of repeat abortions continues to rise. Repeat abortions increased from 20% in 1985 to 37.4% in 1998.
- These combined figures are taken from detailed records in the database for abortions done in 1998 in Canadian clinics and hospitals. These figures represent only 61.1% of the total information required to profile 110,034 abortions and excludes any data for 297 U.S. abortions.
Table 2: Percentage of Therapeutic Abortions by Selected Characteristics for 1998.
| Hospital abortions | Clinic abortions | Total abortions | |
| Total records in database | 68,273 | 41,761 | 110,034 |
| Total detailed records (basis for % distribution) | 46,971 | 20,241 | 67,212 |
| Gestation period | |||
| Under 9 weeks | 29.6 | 53.0 | 36.6 |
| 9 – 12 weeks | 56.9 | 32.3 | 49.5 |
| 13 – 16 weeks | 9.1 | 10.7 | 9.6 |
| Over 16 weeks | 2.4 | 4.0 | 2.9 |
| Unknown | 2.1 | 0.1 | 1.5 (1008 babies) |
*Note: Database includes abortions performed in Canada on Canadian residents only. Only Ontario & Alberta clinics reported.
Comments about the statistics.
In an effort to put a face on the percentages quoted in the table, consider the combined known figures for abortions performed in the hospitals and clinics at 9-12 weeks gestation. At 49.5% distribution this represents at least 33,270 babies destroyed in clinic and hospital abortions by these methods: suction D&C, (the primary initial procedure – 95.2% in 1998), surgical D&C, hysterotomy, hysterectomy, saline, prostaglandin, menstrual extraction and ‘other’ (not defined).
Complications: The average stay in hospitals (and clinics) for an abortion in 1998 was less than one day. Any complications incurred are now reported for the first and second complication (haemorrhage, infection, laceration, perforation, retained products of conception or ‘other’). At least 538 women are reported to have sustained complications: 316 women had retained “products of conception.”
The Provinces with the highest number of abortions are: Ontario (42,452), Quebec (31,673) British Columbia (15,482) and Alberta (10,355).
Historical notes: Before 1969 the law permitted abortion only when necessary to preserve the life of the mother. The law was amended on May 14, 1969 to allow abortion in cases where “the continuation of the pregnancy…would be likely to endanger the life or health of the mother”. The word “health” was not defined. Abortions were to be performed in accredited hospitals with the approval of a therapeutic abortion committee of three doctors. On January 28, 1988 the Supreme Court of Canada struck down the 1969 law on the basis of “unequal access” to Therapeutic Abortion Committees across Canada.
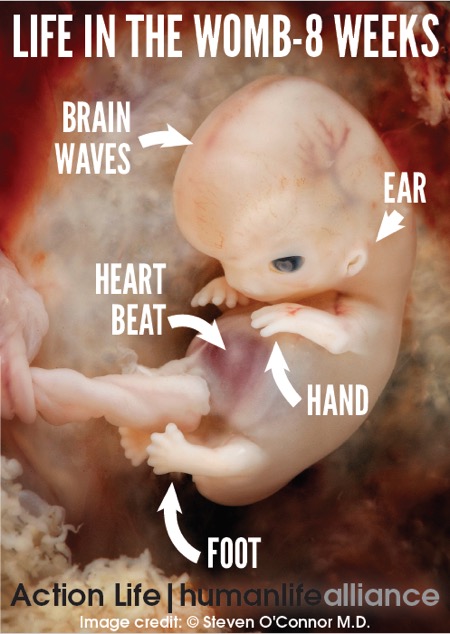
There is no cut-off point in pregnancy after which abortions may not be performed. This means that the child in the womb can be aborted in hospitals and clinics at any time, by any means, for any reason, right up to and during birth with impunity.
Pregnancy is not a disease; however, Statistics Canada reports show that abortion is a frequently performed surgical procedure in Canada.
Abortion is elective surgery which does not cure any medical condition.
Statistics Canada estimates that 1 Canadian woman in 3 will have at least one abortion in her life time.
The leading cause of death in Canada is induced abortion…110,331 deaths in 1998.
Between 1970 and 1998 Canada has sanctioned the deaths of 2,165,050 babies awaiting birth.

